How do we tell the story of a city? The most compelling way probably involves walking across it, listening to stories and using one’s eyes, letting the stories tell themselves. I’ve done that for Duluth before, and historians more learned (and aged) than I am could do a much better job of reaching back into history to create something far better than a simple blog post. No one can really claim expertise without truly getting lost in the woods—in Duluth’s case, quite literally.
And then there’s data. It has its limits. It’s been overhyped in an era when reams of it are available with a few easy clicks. Too often, it’s taken as destiny, its sweeping trends that elide the human dramas playing out every day, across the years and in ever little corner apartment or dead-end street on the hill. But it also takes all of those stories and boils them down into something we can see clearly, and allows us to better understand the broader forces that catalyze events in those lives. It lets us fly above the woods for a bit and see it all before coming back down to earth.
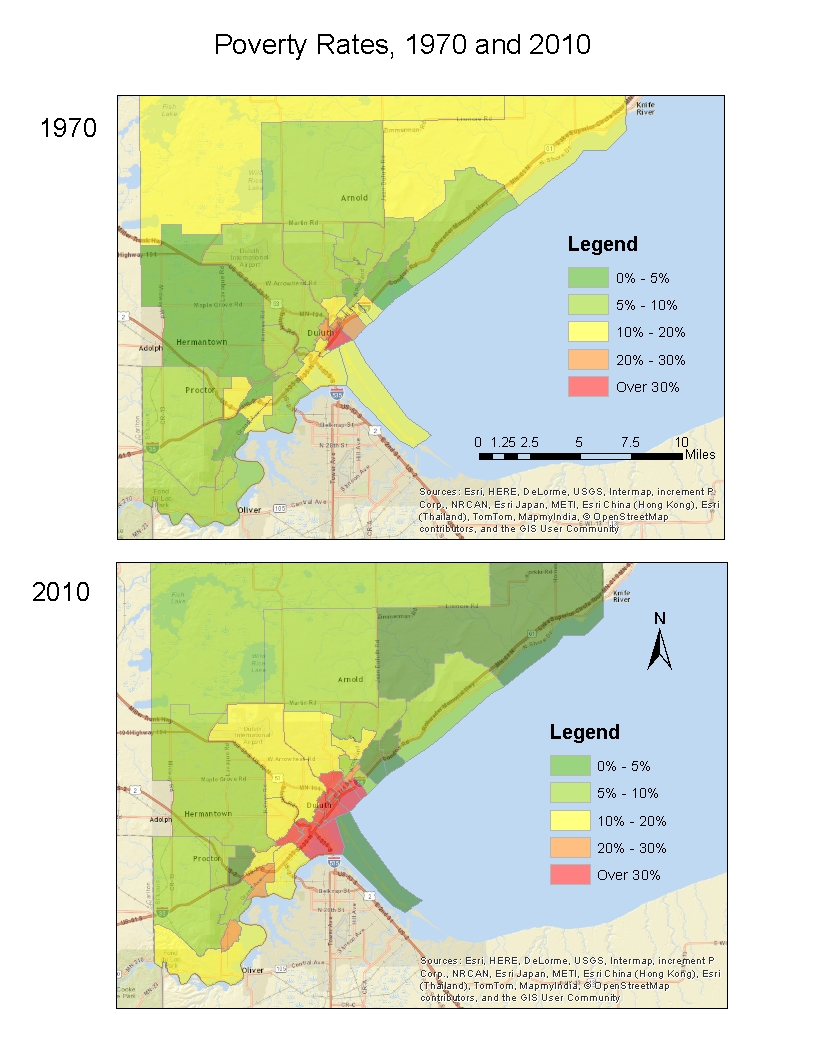
This post uses U.S. census data since to tell the story of Duluth since 1970. I use tract-level data, which usually lines up roughly with neighborhood boundaries. The official map for 2010 is here. I also include the suburbs and outlying townships in St. Louis County; these are an essential part of Duluth’s urban evolution, and using longstanding city boundaries makes for an unhelpful cut-off for a dynamic process. (Someday, I might throw Superior and eastern Carlton County into the hopper, but this will do for now.) I won’t bore casual readers with the methodology notes, but if you want to know how I made these categories, there’s a section on this in the follow-up to this post, which also includes a bunch of supplemental tables.

Actual billboard from Duluth, 1980s. Duluth News Tribune.
This forty-year span was not kind to Duluth. The area of study clocked in 121,398 residents in 1970; just 20 years later, it was down to 108,024. Poverty climbed across the board. This is also only a snapshot: the decline really begins in 1960, which was the high-water mark for the city’s population. Most of the second half of the 20th century was a depressing downhill slide, and stagnation followed before things began to tick upward again. To dig into the details, however, I’ve divided the city into four separate areas that tell different stories about the city and its changes: the east side, the center city, the west side, and the exurban areas. Each one reveals something different afoot in Duluth’s neighborhoods.

Click any image to enlarge it.
After rock-bottom around 1990, though, things start to change. There’s stagnation in some places and resiliency in others; growing gaps in some areas, and dramatic rises elsewhere. Sure, the city’s population has barely budged, and the neighborhood descriptions a mid-90s real estate map I recently discovered—something a map-obsessed kid kept from his parents’ move to Duluth when he was in first grade—could have been written yesterday, and I doubt anyone would know the difference. Yet there are subtle changes here and there, and one has to look beyond the city limits to understand things, too.
A couple of quick notes before we tour Duluth: I’ve tried to name the neighborhoods as they line up with census tracts, but I had to get creative in a few places. Apologies for any grave sins on that front, and check out the map linked to above to see actual boundaries. I’ll also add the necessary warning for all 2010 census data: most of it was collected in 2009, in the depths of the Great Recession, and it therefore tends to make things look a bit worse financially than overall trends would suggest.
East Side Steadiness
Like all of Duluth proper, the east side lost population over the 40 years, but the rate was much slower than in the rest of the city. Population loss is no great surprise in built-up neighborhoods, especially as family sizes decrease. The poverty rate has also held pretty steady, and the few changes have more to do with college students moving in than economic decline. With occasional variation in the difference, incomes stay ahead of the national average. The old streetcar suburbs of Lakeside/Lester Park and Woodland are steady bastions of middle-to-upper-middle-class comfort—I was surprised to see “Lakeside” (roughly 40th to 50th Avenues East) was the lowest-poverty tract in the city. Congdon, meanwhile, remains Duluth’s realm of highly concentrated affluence; if it were its own municipality, it would rank 13th in the state in per capita income, right behind some of the small, opulent enclaves along Lake Minnetonka. One of the more interesting tracts is East End, the area below 4th Street between 20th and 26th Avenues East, which lost a lot of population, but also saw a decrease in poverty and had distinct rise in per capita income. Many of the people who remain are in its grand old houses, and the longstanding Congdon area prestige has withstood Duluth’s post-industrial phase.

Congdon, summarized in one image.
There were noticeable increases in poverty in Hunters Park/Morley Heights and especially Chester Park, though I’d hazard to guess that most of these are the product of growing numbers of college rentals in these areas. I included UMD proper in the east zone, so the school’s growth may help hide some population loss on the east side, though the wider impact of off-campus housing has clearly changed neighborhood dynamics in that area. And while the colleges may cause some decline in the neighborhoods that immediately border them, they more than make up for this by providing very stable, well-paying jobs, both for their employees and their graduates. Time will tell if new apartment developments in the area will stem the tide of converting single-family homes into rentals.

The east side may no longer be the home of many captains of industry, but it has become the home of white-collar professionals, from teachers to doctors for the growing hospitals to the financial and government workers who run the city. Its income may flatline somewhat; there’s not a whole lot of space for development left, and barring aggressive redevelopment—of which there has been some—home values tend to decline with age. But the key anchors are all still there, most indicators are healthy, and there is little reason to expect any changes to this anytime soon. East will remain east.
The Center Collapses
Central Duluth has been slowly hollowed out over the past forty years. It was at the bottom to begin with, but its poverty rate makes for a perfect scissors graph (to borrow a phrase from Robert Putnam), in which the plight of the poor gets steadily worse while the rich hold steady or do better. Duluth is often defined by its east-west gap, but its most glaring divide lies somewhere in the high teen Avenues East. The census tract with the highest poverty rate (Endion) borders the one with per capita income levels that would put it in the company of Edina and Minnetonka on a statewide list (East End).

A chunk of the Endion, East Hillside, and Lower Chester poverty is probably college-related, but those poverty rates glide easily into the neighborhoods in the center of the city, which are undeniably Duluth’s poorest. There’s really no way to spin the statistics for all of these neighborhoods in the center of the city; most were fairly poor in 1970, and are now very poor and continuing to shed population. The one obvious exception is Park Point, whose beachfront lots have only grown more attractive to developers; Observation Hill has also rebounded enough to escape the “lowest” lists, most likely thanks to those fancier houses up near the ridgeline. One other eye-popping statistic, Downtown’s increase in population, dates to the first decade of the study, meaning the likely cause was the construction of high-rises like the Gateway and Lenox towers. It’s been mostly flat ever since.
A tour of the Hillside today will reveal a few changes, from a few new apartments and urban gardens to some serious reclamation efforts of historic buildings, both by the city (as on downtown East Superior Street) and by intrepid owners. I don’t think it’s coincidental that some of Duluth’s most committed public servants, including current mayor Don Ness and his likely successor, Emily Larson, are Hillsiders: these people see several different paths for Duluth around them every day, and are committed to making things right. Things seem to be moving in the center now, with some new low-income housing that will do nothing to disperse poverty, but should at least improve living conditions. Downtowns around the United States are largely on the rebound, and Duluth may someday follow suit. Still, it won’t happen overnight.
The West Side: Post-Industrial Variety
There are a lot of things going on in the data out west, and it’s hard to find an overarching story. The most basic rule to the west side is that wealth gathers on top of the hill: Piedmont ranks right up there with the middle-class east side neighborhoods in 1970 and isn’t far behind in 2010, Cody and the area just above Denfeld does alright for itself, and Bayview Heights saw considerable new development, flipping from the high-poverty list in 1970 to the low-poverty list in 2010. (There’s a decent case for lumping Bayview in with the exurbs, given its greater proximity to Proctor than any part of Duluth.) Lincoln Park mostly behaves like the center of the city, though its poverty has crept outward over time. Denfeld/Oneota, Spirit Valley, Irving, and Morgan Park are on the lower end of things, though not on the level of the center city. Smithville/Riverside/Norton Park, able to reap the benefits of the riverfront without any industry in the area, is somewhat better off, while Gary New Duluth/Fon-du-Lac has grown some, too. The city’s west side redevelopment plan calls for taking advantage of the river, but the neighborhoods with good river access are already doing relatively well compared to the rest of the west side. (I’m not saying there’s an easy policy solution to that, but it’s worth noting.)

The most telling west side statistics may come in a comparison of poverty rates across time. In 1970, poverty was pretty evenly distributed on the east and west sides; two of the four lowest-poverty tracts were out west, and with a couple of exceptions, they are low across the board. The west side wasn’t rich in 1970, but most everyone had access to decent-paying jobs and could stay out of poverty. In 2010, the script has flipped: only a handful of holdouts still have those low poverty rates. While not as extreme as the center, the gaps persist and grow.

Things came apart with the collapse of the manufacturing base in the 1970s and 1980s. A comparison of per capita incomes over time shows fairly steady lines for most of the regions (and the nation as a whole), but the west side takes a sudden detour downhill in the 70s and especially the 80s, the decade in which the U.S. Steel mill in Morgan Park shut down. The west side has bounced back some since, but on the whole, it subtle scissors graphs show a trajectory closer to that of the poverty-stricken center than the steady east or the rising exurbs. This is the demise of blue-collar America in one simple graph.
The Rise of the Hinterlands
A glance at Duluth’s population stats would suggest the city has had flat growth for a long time now, but in reality, the region has been growing since the population bottomed out in 1990. Some growth has happened in areas up “Over the Hill,” but most of the growth has happened beyond the city limits, in a number of townships and Duluth’s two incorporated neighbors, Hermantown and Proctor. Excepting central Proctor and the part of Hermantown that bleeds into Miller Hill Mall, these areas are very sparsely populated; this is why I’ve called them “exurbs” rather than “suburbs.”

In 1970, these exurban areas had low poverty rates, but also low income rates; they were mostly basic rural areas where not much was happening. That means they’ve had plenty of room to go up, and have indeed dominated the lists of greatest ‘climbers’ ever since, both in population and income. Proctor and Midway Township have had modest population losses since 1970, and Rice Lake Township, which was already somewhat built up, has only grown slightly. Otherwise, these areas have all grown by 20 percent or more, and this growth has been accompanied by concurrent gains in wealth. (The only exception to that is the sprawling Kenwood census tract, which has the college population to contend with.) Especially impressive is the strong rise in income between 2000 and 2010, despite the effects of the recession. (The Duluth area as a whole actually held up quite well through the recession, as the center and west declined less than the national average and the east stayed even.) While only a few of them have cracked the “highest income per capita” list, they are on the way up, and poverty remains universally low. Duluth’s middle class, so hollowed out by the industrial decline, has been able to rebound somewhat in the exurbs, where land is cheap and taxes tend to be lower.
So long as the regional economy grows, this trend should carry on. There’s still plenty of space out there, with the caveat that much of its allure stems from its rural character, and that could change as it gets built up. Poverty has made its move toward the inner suburbs in many larger cities, so it will be interesting to see if Duluth follows suit at all; Duluth doesn’t really have inner-ring suburbs, as it had stopped growing at the time most of those arose nationally. That may actually wind up being an asset, as neighborhoods with uniform housing stocks all decay at the same rate, and many Duluth neighborhoods (probably by accident) do a decent job of avoiding that. And while the exurbs have nearly closed the gap in income with the east side, I also suspect that may level off at some point; it’s not as if Duluth has a booming class of nouveau riche, and the pace of development isn’t enough to justify an explosion of McMansions that could topple Congdon from the top of the income list anytime soon.

Thanks a lot, Proctor.
Duluth coexists awkwardly with its exurbs. Township members have forcefully rebuffed occasional attempts to annex territory, and the city has been largely inelastic over the past century. Predictably, township residents have little interest in paying taxes to prop up Duluth’s underclass, and predictably, Duluth points out how much these townships enjoy jobs, shopping, and cultural opportunities without paying to support them. It’s an endless cycle that has been played out in countless cities, though the state of the squabble is usually a good indicator of the economic health of the metro area. When the area is growing, everyone does better, and growth in one area need not come at the expense of another; when things are more stagnant, one’s neighbors become the easy targets for blame. During the worst of the downturn in the 1980s, the exurban areas lost population, just like the rest of the city. Exurban growth is now reality, but stands to gain even more if the more downtrodden parts of Duluth can get back on their feet. It is not a zero-sum game.
Conclusions
Not much here is wildly surprising to anyone who’s paid attention to these things around Duluth, but the numbers and trends throw things into sharp relief. It also fits pretty cleanly with the dominant narrative of American cities since 1970: widening gaps, the isolation of the super-wealthy, the hollowing out of the center, the loss of blue-collar jobs, the rise of the exurbs, and a new creative class. Duluth fits the general mold and that is unlikely to change, though it will be interesting to see if some of the Don Ness Era innovations can push Duluth to the vanguard of the changes instead of trailing along behind the rest of the country. The City of Eternal Air Conditioning is beyond the point where it can just ape the narrative of other mid-sized cities on the Great Lakes. It has to write its own.

Hi Karl, this is so very interesting. You sure know a lot about Duluth. I bet Maureen liked this piece a lot.